The VICON System
The VICON system is an infrared tracking system that is used most commonly for physio therapy assessment and motion capture for CGI, etc. We use this technology to track individuals of groups of 12 birds.

|
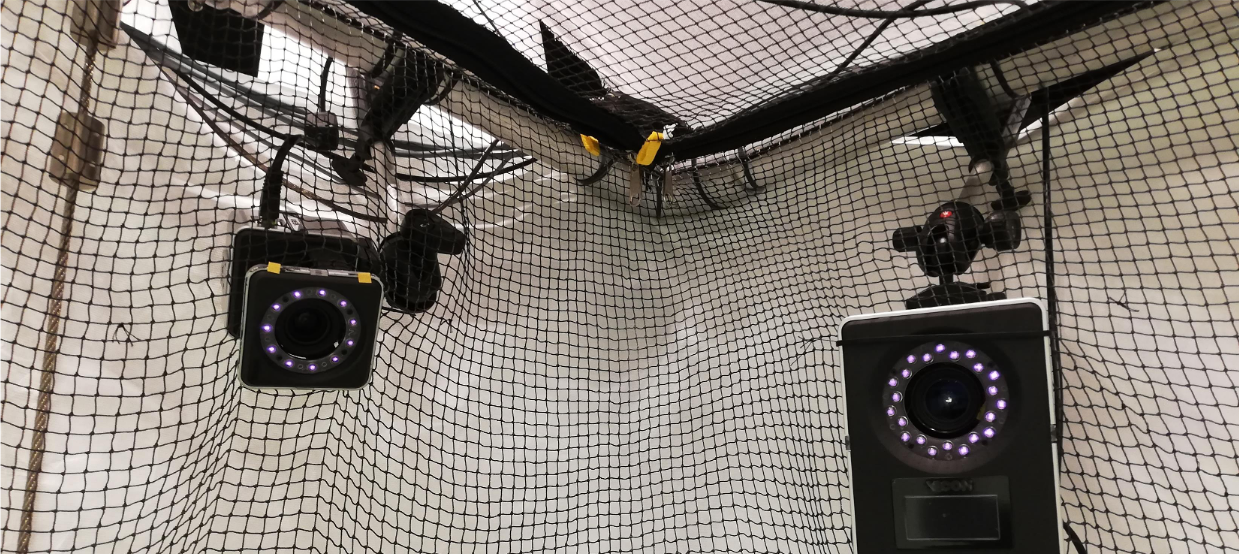
The system contains 2 types of cameras: infrared (those with the ring of infrared LED lights around the lens) and normal RGB visual cameras so we can see everything that is not tracked, or use the image combined with the tracking to make new types of tracking software as Hemal Naik is currently doing.

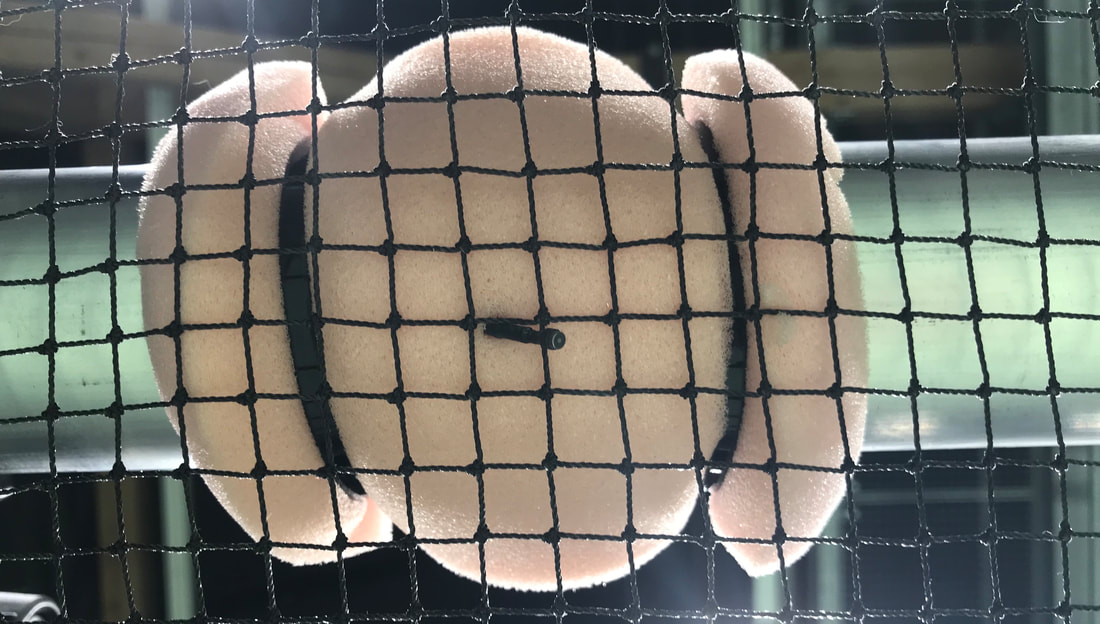
In order to track the starlings, we need to put small backpacks on them which allow the system to track them. Each backpack has a different pattern of infrared reflective markers which we input into the tracking software. This allows us to not only track the birds, but also know which bird is which.
|
|
|
|
The Acoustic Array
|
The Acoustic Array is an array of 30 microphones in the ceiling of the barn designed by Jens Koblitz. It is on the same plane as the VICON cameras. Since all the microphones are synced together, we can use time of arrival delay to determine where each sound is coming from inside the barn. The way this works, is that the closest microphone to a noise source, detects that noise first (as there is a shorter distance for the sound to travel). By determining the delay between that first microphone detecting a sound and at least 3 other microphones detecting that same sound, we can triangulate where the sound is coming from based on how fast sound travels in the air. We use code to make these calculations for us, as well as a call detector which finds all the starling calls which we want to study among all the other noises they make (i.e. preening, pooping, foraging, etc.).
|
|
To study the calls themselves, we use special software that allows us to visualize sound. This is because many species of birds, in essence, hear better and faster than us, meaning that they can tell between two much closer tones than us and hear differences that happen faster than we can hear. For example, when listening to bird song in the spring, many people cannot actually hear the entire song, they miss notes because we are still processing the first note when the second note happens. Because of this, it is much easier to look at sound, than listen to it in order to study it. Spectrograms are what we look at and they are a graphical representation of sound, with frequency (the pitch) on the y-axis, time (often in seconds or milliseconds) on the x-axis, and the amplitude (loudness) of the sound is shown by how dark it is.
|

A spectrogram of two starling calls
|
